グラフをまとめるのはgreplayプロシジャを使います。
GTLさんには座っててもらいましょう。
以下のプログラムは
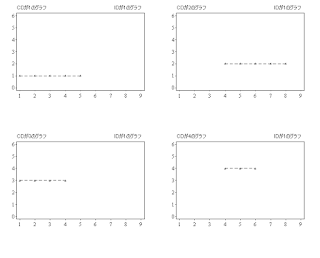
・1ページに4枚のグラフを並べて表示
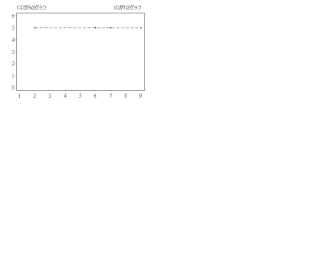
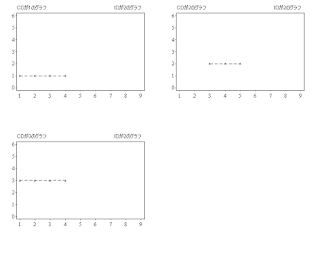
・IDごとに改ページ
・一つのIDの中でもグラフ4枚ごとに改ページ
したRTFファイルを出力するものです。
一番下のods rtfで指定した場所にhoge.rtfが出てきます。
以下の3枚の画像が出力イメージです。


--ここからプログラム-----
/* ---------- testdata --------- */
data test;
id = 1; cd = 1 ; time = 1; value = 1; output;
id = 1; cd = 1 ; time = 2; value = 1; output;
id = 1; cd = 1 ; time = 3; value = 1; output;
id = 1; cd = 1 ; time = 4; value = 1; output;
id = 1; cd = 1 ; time = 5; value = 1; output;
id = 1; cd = 2 ; time = 4; value = 2; output;
id = 1; cd = 2 ; time = 5; value = 2; output;
id = 1; cd = 2 ; time = 6; value = 2; output;
id = 1; cd = 2 ; time = 7; value = 2; output;
id = 1; cd = 2 ; time = 8; value = 2; output;
id = 1; cd = 3 ; time = 1; value = 3; output;
id = 1; cd = 3 ; time = 2; value = 3; output;
id = 1; cd = 3 ; time = 3; value = 3; output;
id = 1; cd = 3 ; time = 4; value = 3; output;
id = 1; cd = 4 ; time = 4; value = 4; output;
id = 1; cd = 4 ; time = 5; value = 4; output;
id = 1; cd = 4 ; time = 6; value = 4; output;
id = 1; cd = 5 ; time = 2; value = 5; output;
id = 1; cd = 5 ; time = 6; value = 5; output;
id = 1; cd = 5 ; time = 7; value = 5; output;
id = 1; cd = 5 ; time = 9; value = 5; output;
id = 2; cd = 1 ; time = 1; value = 1; output;
id = 2; cd = 1 ; time = 2; value = 1; output;
id = 2; cd = 1 ; time = 3; value = 1; output;
id = 2; cd = 1 ; time = 4; value = 1; output;
id = 2; cd = 2 ; time = 3; value = 2; output;
id = 2; cd = 2 ; time = 4; value = 2; output;
id = 2; cd = 2 ; time = 5; value = 2; output;
id = 2; cd = 3 ; time = 1; value = 3; output;
id = 2; cd = 3 ; time = 2; value = 3; output;
id = 2; cd = 3 ; time = 3; value = 3; output;
id = 2; cd = 3 ; time = 4; value = 3; output;
run;
/* ---------- 出力 --------- */
goptions gunit=pct;a
goptions
reset = all
gsfmode = replace
xmax = 6 in
ymax = 9 in
vsize = 5 in
hsize = 9 in
;
*-========================================;
*-グラフ出力位置指定(4枚)*;
proc greplay gout=work.gseg tc=work.tmplt nofs;
tdef PK1
1 / llx=0 lly=50 /*left upper panel*/
ulx=0 uly=100
lrx=50 lry=50
urx=50 ury=100
2 / llx=50 lly=50 /*right upper panel*/
ulx=50 uly=100
lrx=100 lry=50
urx=100 ury=100
3 / llx=0 lly=0 /*left lower panel*/
ulx=0 uly=50
lrx=50 lry=0
urx=50 ury=50
4 / llx=50 lly=0 /*right lower panel*/
ulx=50 uly=50
lrx=100 lry=0
urx=100 ury=50
;
run;
quit;
goptions gunit=pct ;
%macro grepout(_indt = , _wh = );
*---------- annotate macroを有効にする;
%annomac;
*---------- 各グラフの出力を一旦抑制/まとめたグラフ以外は出力不要;
goptions nodisplay;
*---------- 種類をマクロ変数に格納;
data FDAT;
set &_indt.(where = (&_wh.)) end = _EOF;
if _eof = 1 then do;
CD4 = ceil(CD/4);
call symputx("_n" , CD);
call symputx("_n4" , CD4);
end;
drop CD4;
run;
*---------- CDの種類だけGPLOTを実行;
%do i = 1 %to &_n ;
*---------- nameを取得/グラフにnameを表示する;
data _NULL_;
set TEST(where = (CD = &i. and &_wh.));
call symputx("_name" , CD);
call symputx("_id" , ID);
run;
ods escapechar = '^' ;
data anno1;
set TEST(where = (CD = &i.));
length TEXT $80;
%dclanno;
%system(3,3,3);
*---------- 軸ラベル;
%label(20, 95 , "CDが&_name.のグラフ" , black, 0, 0, 4 , 'Arial' , 5);
%label(80, 95 , "IDが&_id.のグラフ" , black, 0, 0, 4 , 'Arial' , 5);
run;
proc gplot data = FDAT(where = (CD = &i.)) anno=anno1;
plot VALUE * TIME / nolegend vaxis = axis1 haxis = axis2 skipmiss ;
symbol1 mode = include v = triangle h = 2 c = black i = join l = 21 w = 1.5;
axis1 /*y軸目盛*/
label=none
offset=(2,2) minor=none major=(w=1.5 h=0.8)
length=60 width=1 order=(0 to 6 by 1)
value=(font='Times New Roman' h=4 )
origin=(10.3, 30);
axis2 /*x軸目盛*/
label=none
offset=(2, 2) minor= none major=(w=1.5 h=0.8)
length=80 width=1 order=( 1 to 9 by 1 )
value=(font='Times New Roman' h=4 )
origin=(10.3, 30);
run;
quit;
%end;
*---------- グラフの出力を再開_4グラフ1ページのものだけを出力;
goptions hsize = 9 in display;
*-出力;
%macro greplay/*(path=, out=)*/;
%put Number of Parameter is &_n;
%put Number of Page is &_n4.;
%do i = 1 %to &_n4. %by 1;
%if %eval(&i) = 1 %then %let j = 1;
%else %let j = %eval(&j + 4);
%put i is &i.;
%put j is &j.;
proc greplay igout=work.gseg gout=work.gseg tc=work.tmplt nofs;
template PK1;
%if &_n4. = 1 %then %do;
treplay 1:gplot
2:gplot1
3:gplot2
4:gplot3
;
%end;
%if &_n4. >= 2 and &i = 1 %then %do;
treplay 1:gplot
2:gplot1
3:gplot2
4:gplot3
;
%end;
%if &_n4 >= 2 and &i >= 2 %then %do;
treplay 1:gplot%eval(&j - 1)
2:gplot%eval(&j)
3:gplot%eval(&j+1)
4:gplot%eval(&j+2)
;
%end;
quit;
%end;
%mend greplay;
%greplay
*---------- 出力したグラフをリセット;
proc catalog catalog = work.Gseg kill ;
run;
quit ;
%mend grepout;
ods listing close;
ods rtf file = "hogehoge\hoge.rtf";
%grepout(_indt = TEST , _wh = %nrstr(ID = 1) );
%grepout(_indt = TEST , _wh = %nrstr(ID = 2) );
ods rtf close;
ods listing;