ラベル gplot の投稿を表示しています。 すべての投稿を表示

2018年3月3日土曜日

グラフのラベルに改行を入れる話

SASでグラフを出す時に,軸のラベルや軸目盛の値の改行をするにはannotateをするしかない,と思っていました.
ところがどっこいaxisステートメントの指定の仕方で改行できるようです.
軸ラベルを改行させてほしいとリクエストが来るたびに,相手のことを呪っていたわけですが
これからはそんな呪いからも解放されますね.

sgplotで軸目盛のラベルの改行は出来たのですが,軸そのものへのラベルの改行のやり方が分からないのが次なる課題ですね...

/*---------- testデータ ----------*/

data hoge;
    call streaminit(11);
    do A=1 to 5;
        Y = int(rand('uniform') *10 );
        output;
    end;
run;

*---------- gplotでの場合 ;
proc gplot data = hoge;
    plot Y * A / vaxis = axis1 haxis = axis2 ;
    symbol1 c = black V = dot I = join;

    *---------- y軸目盛;
    axis1
      order = (0 to 5 by 1)
      origin=(10, 30)
      ;

    *---------- x軸目盛;
    axis2
      order=( 1 to 5 by 1 )
      origin=(10, 30)
      label=("x軸" j = c "ラベル")
      value=(tick = 1 "1" j = c "時間" j=c "経過"
             tick = 2 "2" j = c "時間" j=c "経過"
             tick = 3 "3" j = c "時間" j=c "経過"
             tick = 4 "4" j = c "時間" j=c "経過"
             tick = 5 "5" j = c "時間" j=c "経過"
            )
    ;
 run;

gplotでの出力イメージ


*---------- sgplotでの場合 ;
proc sgplot data = hoge  ;
    series x = A y = Y  ;

    xaxis
      type  = discrete
      fitpolicy=splitalways
      splitchar="*"
      label="x軸ラベル"
      values=(1 2 3 4 5)
      valuesdisplay=("1*時間*経過" "2*時間*経過" "3*時間*経過" "4*時間*経過" "5*時間*経過")
    ;   
run ;

sgplotでの出力イメージ

2017年3月21日火曜日

複数のグラフを1枚にまとめる話_今回は4枚のグラフを一つに

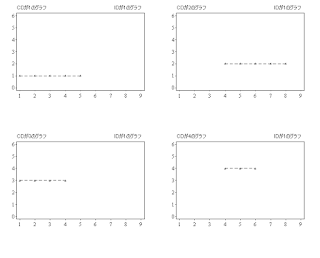
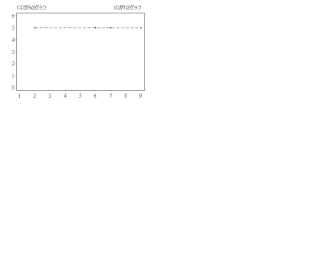
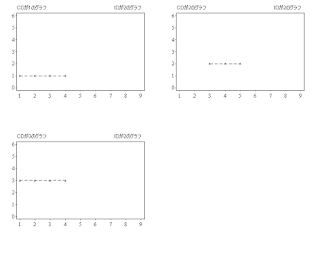
何枚かのグラフを一枚の紙に出力したいときのお話です。
グラフをまとめるのはgreplayプロシジャを使います。
GTLさんには座っててもらいましょう。

以下のプログラムは
・1ページに4枚のグラフを並べて表示
・IDごとに改ページ
・一つのIDの中でもグラフ4枚ごとに改ページ
したRTFファイルを出力するものです。

一番下のods rtfで指定した場所にhoge.rtfが出てきます。

以下の3枚の画像が出力イメージです。


--ここからプログラム-----

/* ---------- testdata --------- */
data test;
    id = 1; cd = 1 ; time = 1; value = 1; output;
    id = 1; cd = 1 ; time = 2; value = 1; output;
    id = 1; cd = 1 ; time = 3; value = 1; output;
    id = 1; cd = 1 ; time = 4; value = 1; output;
    id = 1; cd = 1 ; time = 5; value = 1; output;
    id = 1; cd = 2 ; time = 4; value = 2; output;
    id = 1; cd = 2 ; time = 5; value = 2; output;
    id = 1; cd = 2 ; time = 6; value = 2; output;
    id = 1; cd = 2 ; time = 7; value = 2; output;
    id = 1; cd = 2 ; time = 8; value = 2; output;
    id = 1; cd = 3 ; time = 1; value = 3; output;
    id = 1; cd = 3 ; time = 2; value = 3; output;
    id = 1; cd = 3 ; time = 3; value = 3; output;
    id = 1; cd = 3 ; time = 4; value = 3; output;
    id = 1; cd = 4 ; time = 4; value = 4; output;
    id = 1; cd = 4 ; time = 5; value = 4; output;
    id = 1; cd = 4 ; time = 6; value = 4; output;
    id = 1; cd = 5 ; time = 2; value = 5; output;
    id = 1; cd = 5 ; time = 6; value = 5; output;
    id = 1; cd = 5 ; time = 7; value = 5; output;
    id = 1; cd = 5 ; time = 9; value = 5; output;
    id = 2; cd = 1 ; time = 1; value = 1; output;
    id = 2; cd = 1 ; time = 2; value = 1; output;
    id = 2; cd = 1 ; time = 3; value = 1; output;
    id = 2; cd = 1 ; time = 4; value = 1; output;
    id = 2; cd = 2 ; time = 3; value = 2; output;
    id = 2; cd = 2 ; time = 4; value = 2; output;
    id = 2; cd = 2 ; time = 5; value = 2; output;
    id = 2; cd = 3 ; time = 1; value = 3; output;
    id = 2; cd = 3 ; time = 2; value = 3; output;
    id = 2; cd = 3 ; time = 3; value = 3; output;
    id = 2; cd = 3 ; time = 4; value = 3; output;
run;

/* ---------- 出力 --------- */
  goptions gunit=pct;a
  goptions
      reset   = all
      gsfmode = replace
      xmax    = 6 in
      ymax    = 9 in
      vsize   = 5 in
      hsize   = 9 in
  ;
*-========================================;
*-グラフ出力位置指定(4枚)*;
  proc greplay gout=work.gseg tc=work.tmplt nofs;
    tdef PK1
   
    1 / llx=0 lly=50                                                            /*left upper panel*/
        ulx=0 uly=100
        lrx=50 lry=50
        urx=50 ury=100
   
    2 / llx=50 lly=50                                                           /*right upper panel*/
        ulx=50 uly=100
        lrx=100 lry=50
        urx=100 ury=100
   
    3 / llx=0 lly=0                                                             /*left lower panel*/
        ulx=0 uly=50
        lrx=50 lry=0
        urx=50 ury=50
   
    4 / llx=50 lly=0                                                            /*right lower panel*/
        ulx=50 uly=50
        lrx=100 lry=0
        urx=100 ury=50
   ;
  run;
  quit;

goptions gunit=pct ;
%macro grepout(_indt = , _wh = );
*---------- annotate macroを有効にする;
%annomac;

*---------- 各グラフの出力を一旦抑制/まとめたグラフ以外は出力不要;
goptions nodisplay;

*---------- 種類をマクロ変数に格納;
data FDAT;
    set &_indt.(where = (&_wh.)) end = _EOF;
    if _eof = 1 then do;
        CD4 = ceil(CD/4);
        call symputx("_n" , CD);
        call symputx("_n4" , CD4);
    end;
    drop CD4;
run;

*---------- CDの種類だけGPLOTを実行;
%do i = 1 %to &_n ;

    *---------- nameを取得/グラフにnameを表示する;
    data _NULL_;
        set TEST(where = (CD = &i. and &_wh.));
        call symputx("_name" , CD);
        call symputx("_id" , ID);
    run;

    ods escapechar = '^' ;

    data anno1;
        set TEST(where = (CD = &i.));
        length TEXT $80;
        %dclanno;
        %system(3,3,3);
 
        *---------- 軸ラベル;
        %label(20, 95  , "CDが&_name.のグラフ" , black, 0, 0, 4 , 'Arial'  , 5);
        %label(80, 95  , "IDが&_id.のグラフ" , black, 0, 0, 4   , 'Arial'  , 5);
    run;

    proc gplot data = FDAT(where = (CD = &i.)) anno=anno1;
 
        plot  VALUE  * TIME   / nolegend vaxis = axis1 haxis = axis2 skipmiss ;      
        symbol1 mode = include v = triangle h = 2 c = black  i = join l = 21 w = 1.5;

        axis1                                                                   /*y軸目盛*/
          label=none
          offset=(2,2)  minor=none major=(w=1.5 h=0.8)
          length=60 width=1 order=(0 to 6 by 1)
          value=(font='Times New Roman' h=4 )
          origin=(10.3, 30);

        axis2                                                                   /*x軸目盛*/
          label=none
          offset=(2, 2)  minor= none  major=(w=1.5 h=0.8)
          length=80 width=1 order=( 1 to 9 by 1 )
          value=(font='Times New Roman' h=4 )
          origin=(10.3, 30);
    run;
    quit;
%end;

*---------- グラフの出力を再開_4グラフ1ページのものだけを出力;

goptions hsize = 9 in display;

*-出力;
    %macro greplay/*(path=, out=)*/;
      %put Number of Parameter is &_n;
      %put Number of Page is &_n4.;
      %do i = 1 %to &_n4. %by 1;
       
        %if %eval(&i) = 1 %then %let j = 1;
                          %else %let j = %eval(&j + 4);
        %put i is &i.;
        %put j is &j.;
        proc greplay igout=work.gseg gout=work.gseg tc=work.tmplt nofs;
          template PK1;
          %if &_n4. = 1  %then %do;
            treplay 1:gplot
                    2:gplot1
                    3:gplot2
                    4:gplot3
            ;
          %end;
          %if &_n4. >= 2 and &i = 1 %then %do;
            treplay 1:gplot
                    2:gplot1
                    3:gplot2
                    4:gplot3
            ;
          %end;

          %if &_n4 >= 2 and &i >= 2  %then %do;
            treplay 1:gplot%eval(&j - 1)
                    2:gplot%eval(&j)
                    3:gplot%eval(&j+1)
                    4:gplot%eval(&j+2)
            ;
          %end;
        quit;
      %end;
    %mend greplay;
    %greplay

    *---------- 出力したグラフをリセット;
    proc catalog  catalog = work.Gseg kill  ;
        run;
   
    quit ;
%mend grepout;

ods listing close;
ods rtf file = "hogehoge\hoge.rtf";

%grepout(_indt = TEST , _wh = %nrstr(ID = 1) );
%grepout(_indt = TEST , _wh = %nrstr(ID = 2) );

ods rtf close;
ods listing;

2017年2月3日金曜日

グラフの中の軸の範囲外の値を、はみ出ていることが分かるように出力する話

通常sasのgplotで出力したグラフは、軸に設定した値に収まらないデータがいる場合、
ログに範囲外のデータがいますよってnoteを出してくれます。
出してくれますが、出力したグラフを見てもどこが範囲外のデータなのかはわかりません。
今回ははみ出たデータをグラフにそれとわかるように出力するお話です。

data hoge;
    a = 1; Y = 2; output;
    a = 2; Y = 3; output;
    a = 3; Y = 4; output;
    a = 4; Y = 5; output;
    a = 5; Y = 3; output;
    a = 6; Y = 7; output;
    a = 7; Y = 4; output;
    a = 8; Y = 8; output;
    a = 9; Y = 4; output;
run;


*---------- 何の設定もしない場合;
proc gplot data = hoge;
    plot Y * A / vaxis = axis1 haxis = axis2 ;
    symbol1 c = black V = dot I = join;
    *---------- y軸目盛;
    axis1
      order = (1 to 5 by 1)
      origin=(10, 30)
      ;
    *---------- x軸目盛;
    axis2
      order=( 1 to 10 by 1 )
      origin=(10, 30)
    ;
run;

範囲外のデータがいますよのログ


グラフ


追加する設定は、symbolステートメントに追加された mode = include のことです。
*---------- 軸の幅を値が超えていたらはみ出るように設定;
proc gplot data = hoge;
    plot Y * A / vaxis = axis1 haxis = axis2 ;
    symbol1 mode = include c = black V = dot I = join;
    *---------- y軸目盛;
    axis1
      order = (1 to 5 by 1)
      origin=(10, 30)
      ;
    *---------- x軸目盛;
    axis2
      minor = none major = (w = 1.5)
      order=( 1 to 10 by 1 )
      origin=(10, 30)
    ;
run;


これではみ出たことがわかります。
はみ出るだけでなく、範囲外のデータを計算に含めることもできます。

2016年12月13日火曜日

グラフにしたいデータセットの欠測値のところでグラフをつなげないようにする話

データに欠測が無かったら、以下を実行するとグラフが出ますね。
(いまどきgplotかよとの指摘は今はご勘弁を…)
data hoge;
    a = 1; Y = 2; output;
    a = 2; Y = 3; output;
    a = 3; Y = 4; output;
    a = 4; Y = 5; output;
    a = 5; Y = 3; output;
    a = 6; Y = 7; output;
    a = 7; Y = 5; output;
    a = 8; Y = 8; output;
    a = 9; Y = 4; output;
run;
proc gplot data = hoge;
    plot Y * A ;
    symbol1 c = black V = dot I = join;
run;


もしデータに欠測があった場合、普通にやるとそこは線でつながります。
data hoge;
    a = 1; Y = 2; output;
    a = 2; Y = 3; output;
    a = 3; Y = 4; output;
    a = 4; Y = 5; output;
    a = 5; Y = 3; output;
    a = 6; Y = .; output;
    a = 7; Y = 5; output;
    a = 8; Y = 8; output;
    a = 9; Y = 4; output;
run;
proc gplot data = hoge;
    plot Y * A ;
    symbol1 c = black V = dot I = join;
run;


欠測のところで線を区切って欲しいときは、skipmissオプションを指定します
data hoge;
    a = 1; Y = 2; output;
    a = 2; Y = 3; output;
    a = 3; Y = 4; output;
    a = 4; Y = 5; output;
    a = 5; Y = 3; output;
    a = 6; Y = .; output;
    a = 7; Y = 5; output;
    a = 8; Y = 8; output;
    a = 9; Y = 4; output;
run;
proc gplot data = hoge;
    plot Y * A /skipmiss;
    symbol1 c = black V = dot I = join;
run;


2016年9月29日木曜日

sasにもともと入ってるマクロの話

annotate macroの話です
毎度仕様を忘れて手こずるので書いときます
適宜追加するかもです

使うとき
%annomac;を宣言してあげます
これ書かないとマクロと認識してくれません

グラフとかに出力する場所の設定
  %system(3,3,3);
 *以降で指定する数字を百分率として扱います。画面を100%と見たときの割合で場所を指定できるようになります。
当然XとYに100を超える値を、これより下のannotate macroで指定したらERRORでます;


  %system(2, 3, 3);
 *以降で指定する数字は絶対値として扱います。グラフの軸の値に従って指定できるので便利です。;


グラフとかに文字を追加する

     %label(6    , 98  , "hogehoge"   , black,  0   , 0  ,  3.0   , 'MS Mincho',  5            ); 
 *%label(X,Y,"出力する文字列", 色   , 文字列の角度(0 - 360),文字の角度  , 文字size ,  font      , position(1-9) );

20161118更新_間違ってました。以下の数字以外は今度追加します
    /* positionについて
    4 = 中央   (右)
    5 = 中央   (真ん中)  標準値
    6 = 中央   (左)
    */
201611118更新ここまで


グラフとかに線を追加する
    %line( 1        , 30    ,  1       ,  28.5    , black , 1   , 0.15   ); 
   *%line(始点x , 始点Y , 終点X , 終点Y , 色    ,線種 ,線の太さ);
線種はいろんな数字を指定できます。1が実線で、あとは点線の具合が変わります。
線種はそこそこ多くの指定ができます。なんなら二桁とかもいけます。

仕様を忘れる筆頭のREPORTプロシジャとGPLOTプロシジャについても上げたいですね